 |
 |
 |
Funded
in part by  |
Research Elements |
Tectonic Elements |
|
MegathrustThe subduction zone that carries the Australian and Indian plates beneath Sumatra has been the source of Indonesia's largest earthquakes. We have been studying its paleogeodetic and paleoseismic history, because it affords a unique opportunity to recover precisely dated histories of seismic and interseismic deformation.
|
Great Sumatran FaultThe Great Sumatran fault carries most of the strike-slip component of oblique convergence across the Sumatran plate boundary. Sieh and Natawidjaja (2000) present the
segmented geometry of the fault, its relationship to the Sumatran
volcanic arc and subduction zone, and speculations about its
developmental history and earthquake potential. Sieh, K. et al. (1994) describe preliminary
studies of late Quaternary slip rate variations along the fault. |
Click on the
thumbnail images
for more detailed information.
Sumatran Fault System |


Sumatran gps array (SuGAr) |
The intriguing paleogeodetic record of deformation seen in the coral microatolls of the western Sumatra led us to establish a network of continuously recording GPS stations there. Between September 2002 and mid-2004 we established 14 stations in the region of of our coral studies. After the December 2004 earthquake, we established four additional stations farther north, in Aceh and North Sumatra. We plan to construct ten more stations by August 2005. |
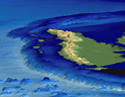
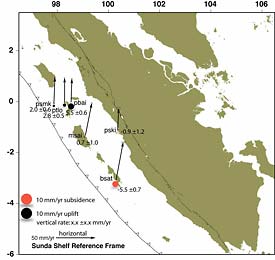
As of August 2005, the SuGAr network consisted of 24 permanent stations along the Sumatran plate boundary (Figure 1). Prior to the giant Aceh-Andaman earthquake of December 2004, the SuGAr network was showing steady convergence of the outer-arc islands toward the mainland coast (Figure 2). During the Aceh-Andaman earthquake, the network recorded sub-centimeter motions toward the south and east. During the Nias-Simeulue earthquake of March 28th, stations from the Equator north recorded substantial motions (Figure 3). |
|
Existing stations of the Sumatran cGPS Array (SuGAr). |
|
Average annual horizontal motion for the six stations installed in 2002. |
 Fig 3 - enlarge |
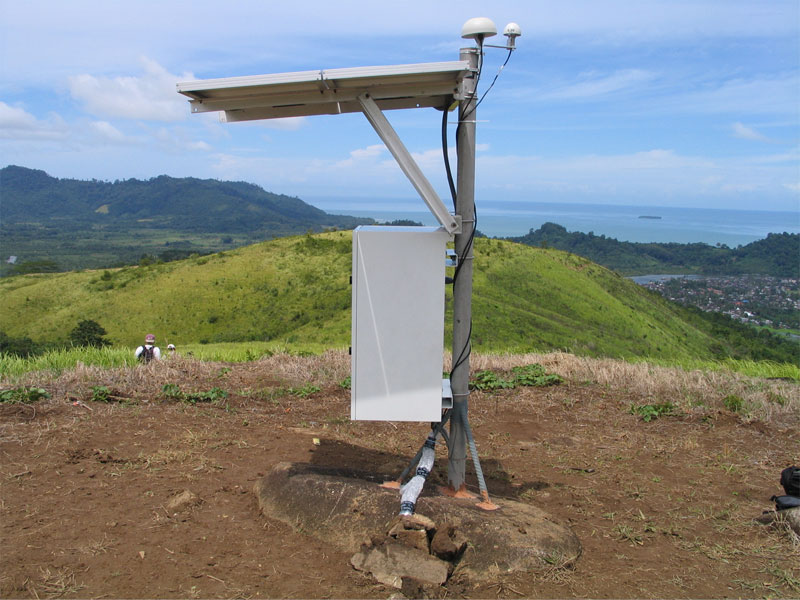
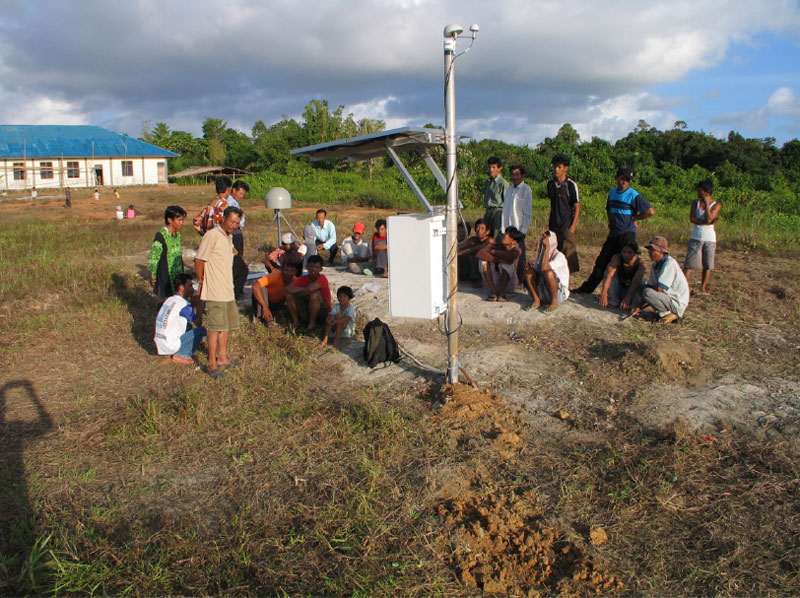
Short-Period Seismic Array Six short-period seismic stations have been installed on Sumatra in order to better determine the locations of aftershocks of the recent Dec 26, 2004 and Mar 28, 2005 great earthquakes in the Sunda Trench.
|
|||||||||||||||||||||||||||||
The sites are located as indicated in following table and figure. Each site has an L4 1-Hz vertical seismometer recorded by a Nanometerics Taurus 24-bit logger. The data are recorded on site and are retrieved at regular intervals up to 3 months apart. The instruments were installed starting May 20, 2005, co-located with GPS stations of the SuGAr array. Link to data |
|||||||||||||||||||||||||||||
|
|||||||||||||||||||||||||||||
The following people helped install this network.
|
|||||||||||||||||||||||||||||
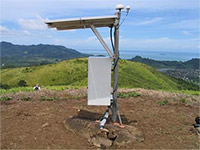 Air Bangis station - enlarge image |
|||||||||||||||||||||||||||||
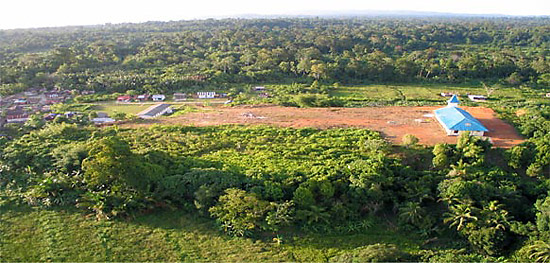 Silabu village with the station in the middle of the dirt area; blue-roofed church at right. enlarge image |
|||||||||||||||||||||||||||||

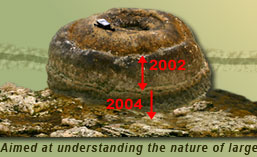
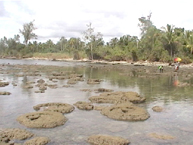
Subduction Zone/CoralsThe coral and the GPS data are enabling more robust modeling of the behavior of the subduction interface. We are delineating more fully the nature of rupture during the 1797, 1833, 2004 and 2005 giant earthquakes and the nature of interseismic and post-seismic slip on the interface (Sieh et al., 2004; Chlieh et al., 2004; Subarya et al., in press; Briggs et al., in press). Our early work (Zachariasen et al., 2000) showed that we could recover records of sea level from living coral microatoll colonies by studying their annual growth bands and morphology. We found that many of the offshore islands of Sumatra have been slowly sinking over the past few decades. |
|
 |
 |
| View animations: Coral growth in response to sea level changes. | |
| Our early work also demonstrated
that sudden uplifts of about 1 to 2 meters occurred in association
with a historical great earthquake in 1833 (Zachariasen
et al., 1999). Our modeling of the pattern of
uplift suggested that the 1833 earthquake resulted from slip of
about 12 meters on a large section of the subduction interface
south of the Equator |
|
 |
Near the Equator, the patterns of uplift, submergence and stability have been nearly stable since the early 1960s. Our modeling of these motions (Sieh et al., 1999) suggested that the shallow section of the subduction interface near the Equator has been locked or nearly locked for the past few decades. |
More thorough
investigation of modern and fossil microatolls near the Equator
(Natawidjaja,
2003; Natawidjaja
et al., 2004) revealed a systematic uplift, submergence
and tilt associated with the major earthquake of 1935. Our
modeling of these deformations, in concert with modeling of historical
seismograms (Rivera
et al., 2002) showed that the earthquake was produced
by slip of about 2.5 meters on a 35 by 70-km patch of the subduction
interface. |
 |
 |
Ongoing work is aimed at a more thorough characterization of the giant earthquake of 1833 and its large predecessor in 1797. We are also extracting a record of nearly periodic ruptures of the subduction interface south of the Equator over the past seven centuries. |