Apr./01/2014 (Mw 8.1), Iquique, Chile
Location of Epicenter |
Overview
|
Chile is located at the boundary between the Nazca plate and the South American plate. These plates are converging at 8 cm/year.
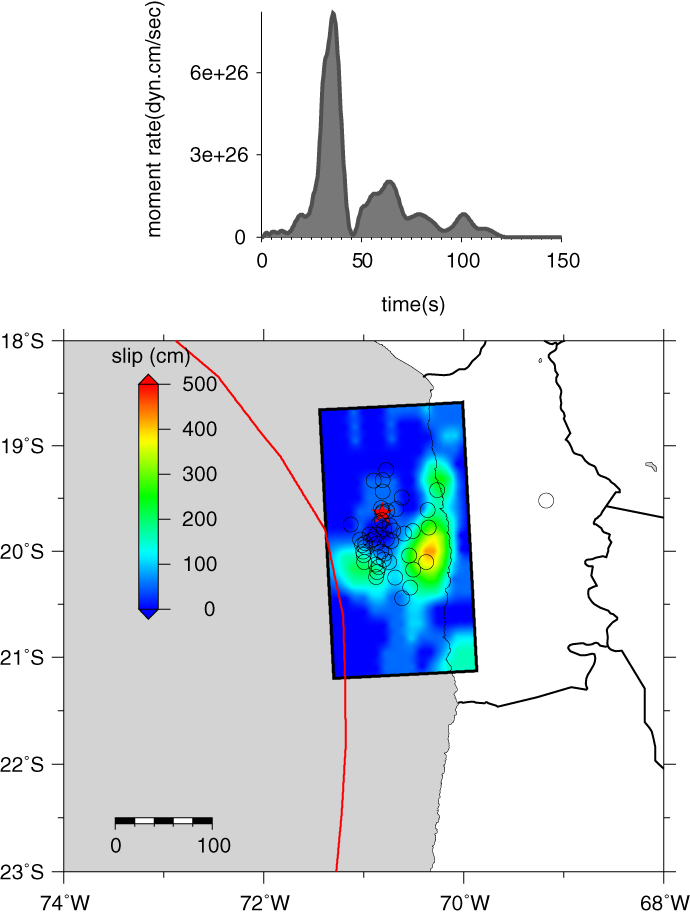
The rectangle in the figure shows the location and length of the rupture zone. The red star indicates the epicenter. The rupture was bilateral, i.e., it spread away from the epicenter in both the north and south directions, taking two minutes to cover a total of 600 km (370 miles).. The colors show the slip amplitude (i.e., the amount by which the land on one side of the fault moved with respect to the land on the other side). The motion was mainly thrust-fault (land on the Nazca plate subducting under land on the South American plate - see animation). |
DATA Process and Inversion
The source model is obtained by inversion of GSN broadband data downloaded from the IRIS DMC. We analyzed 91 teleseismic P and SH waveforms selected based upon data quality and azimuthal distribution. Waveforms are first converted to displacement by removing the instrument response and then used to constrain the slip history based on a finite fault inverse algorithm (Ji et al, 2002). The epicenter location and point source mechanism (Global Moment Tensor Solution) are based on the information provided by NEIC (Lon.=-19.6423°, ; Lat.=-70.817°). 1D velocity model is extracted from the CRUST2.0 global tomography model (Bassin et al., 2000). The fault plane with strike of 357 degree and dip of 18 degree (based on GCMT solution) is used for the inversion.Result:
Cross-section and mapview of slip distribution

Figure 1: Upper: the source time function showing the time evolution of released moment rate. Middel: cumulative slip (arrows show slip vectors, and color coding shows amplitude) and isochrons of the seismic rupture. The rupture times are given relative to the onset of slip at the epicenter. Lower: map view of the slip distribution with circles indicate the seismicity 5 days before and 1 day after the mainshock.
Comparison of data and synthetic seismograms

Figure 2: Comparison of the observed (black) and modeled (red) teleseismic seismograms (in displacement). Station names are indicated to the left of the traces along with the azimuths and epicentral distances in degrees. Peak amplitude in micron of data is indicated above the end of each trace.
Comments:
Download
(Slip Distribution)
| SUBFAULT FORMAT | FSP FORMAT | CMTSOLUTION FORMAT | SOURCE TIME FUNCTION |
References
Ji, C., D.J. Wald, and D.V. Helmberger, Source description of the 1999 Hector Mine, California earthquake; Part I: Wavelet domain inversion theory and resolution analysis, Bull. Seism. Soc. Am., Vol 92, No. 4. pp. 1192-1207, 2002.Bassin, C., Laske, G. and Masters, G., The Current Limits of Resolution for Surface Wave Tomography in North America, EOS Trans AGU, 81, F897, 2000.
USGS National Earthquake Information Center: http://neic.usgs.gov
Global Seismographic Network (GSN) is a cooperative scientific facility operated jointly by the Incorporated Research Institutions for Seismology (IRIS), the United States Geological Survey (USGS), and the National Science Foundation (NSF).
‹Back to Slip Maps for Recent Large Earthquakes home page
© 2004 Tectonics Observatory :: California
Institute of Technology :: all rights reserved