Updated Result
3/11/2011 (Mw 9.0), Tohoku-oki, Japan
Shengji Wei (Caltech), Anthony Sladen (Geoazur-CNRS) and the ARIA group (Caltech-JPL).
Location of Epicenter |
Amount of Slip on Fault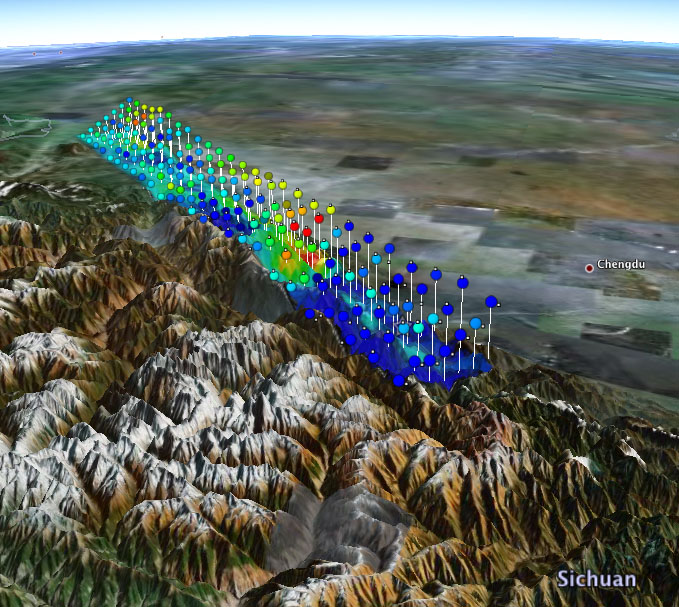
View in Google Earth (requires Google Earth) Colors show the amount of slip on different sections of the fault zone. Two views are shown (either view can be de-selected on the Google Earth sidebar):
|
Overview

|
The Tohoku-oki earthquake is located at the boundary between the Pacific plate and the North American plates. These plates are converging at about 8 cm/year.
The rectangle in the figure shows the location and length of the rupture zone. The red star indicates the epicenter. The rupture was bilateral, i.e., it spread away from the epicenter in both the north and south directions, taking about 2 minutes to cover a total of 400 km (250 miles). This magnitude 9.0 earthquake was more than 500 times stronger than the Haiti earthquake of January 2010. The colors show the slip amplitude (i.e., the amount by which the land on one side of the fault moved with respect to the land on the other side). The motion was mainly thrust-fault (see animation). The rupture originated about 24 km (15 miles) below the surface. In some places, the slippage along the fault was as large as 30 meters (100 feet), shown by red-shaded areas. The coast of Japan sprang east, into the ocean, in some places by as much as 5 m (16 feet). |
DATA Process and Inversion
We used the GSN broadband data downloaded from the IRIS DMC and GPS data.The GPS data are preliminary solution (version 1.0) provided by the ARIA team at JPL and Caltech. All Original GEONET RINEX data provided to Caltech by the Geospatial Information Authority (GSI) of Japan.
For the seismological part, we analyzed 27 teleseismic P waveforms and 21 SH waveforms selected based upon data quality and azimuthal distribution. Waveforms are first converted to displacement by removing the instrument response and then used to constrain the slip history based on a finite fault inverse algorithm (Ji et al, 2002). The epicenter location is based on the JMA estimate (Lon.=142.8 ° Lat.=38.05 ° depth=24 km). The dip angle is taken from the NEIC W-phase solution (dip=14 °) and the 1D velocity model is extracted from the CRUST2.0 global tomography model (Bassin et al., 2000). The strike of the fault plane (strike=193 °) was adjusted to match the orientation of the subduction zone in the are of maximum slip.
Result
The solution is made of one relatively continuous slip patch stretched relatively equally north and south of the epicenter, with most of the slip concentrated above the epicenter.Cross-section of slip distribution
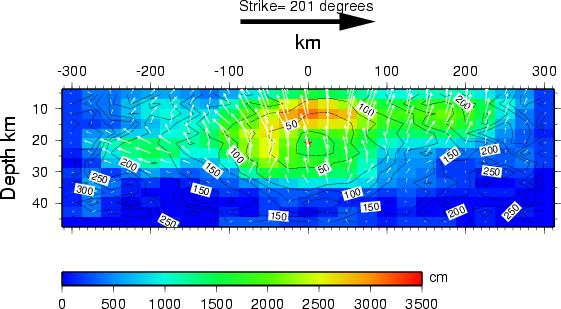
Figure 1: The colors show the slip amplitude and white arrows indicate the direction of motion of the hanging wall relative to the footwall. Contours correspond to the propagation of the rupture front, and the red star indicates the hypocenter location. The big black arrow gives the orientation of the fault plane.
Comparison of data and synthetic seismograms
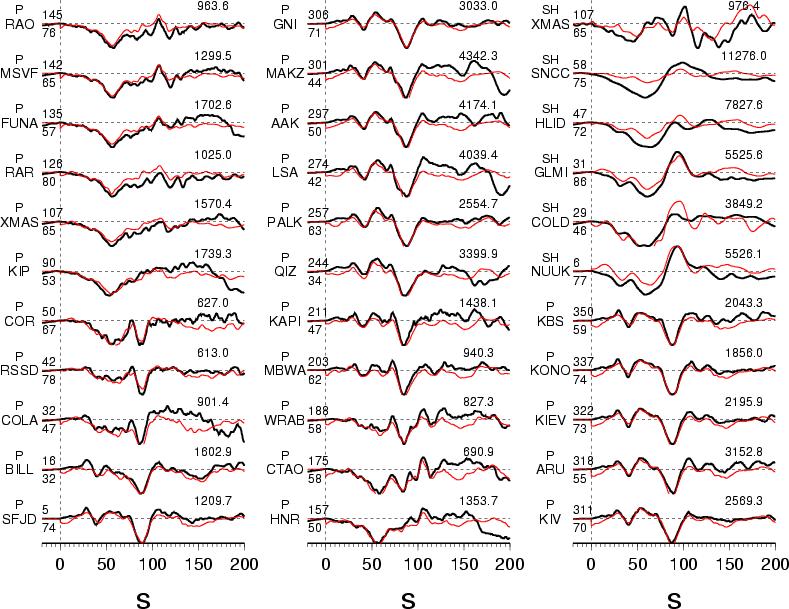
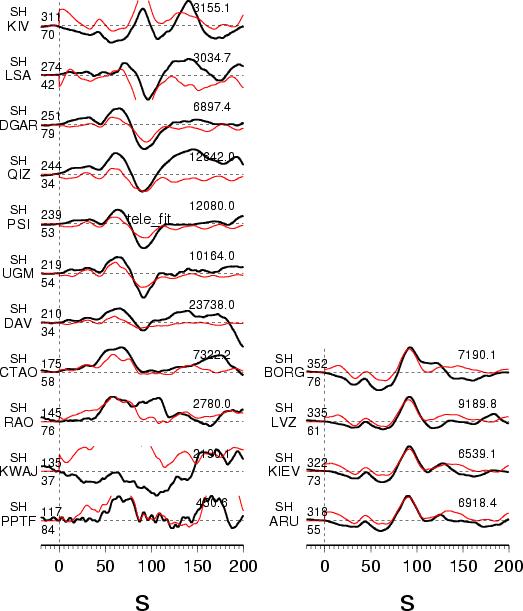
Figure 2: The Data are shown in black and the synthetic seismograms are plotted in red. Data are aligned on the theoretical P-wave arrival (IASPEI earth model). The number at the end of each trace is the peak amplitude of the observation in micro-meter. The number above the beginning of each trace is the source azimuth and below it is the epicentral distance.
Map view of the slip distribution
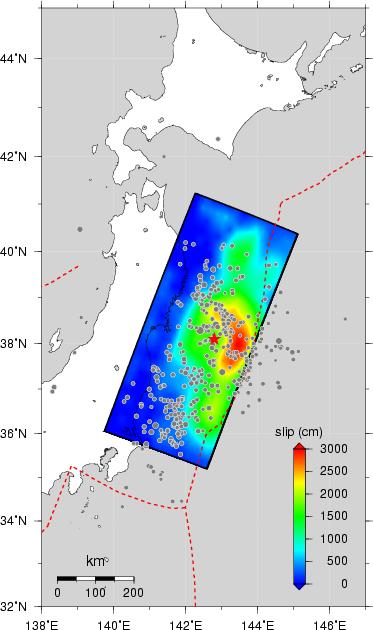
Figure 3: Surface projection of the fault plane slip distribution. The red star represents the epicenter of this event. The grey dots are the aftershocks located by USGS during the day following the event. The inset correspond to the source time function.
Observed and predicted GPS displacements
(GPS solution processed by the Caltech-JPL ARIA group)

Figure 4: Observed (black) and predicted (red) horizontal GPS displacements.

Figure 5: Observed (black) and predicted (red) vertical GPS displacements.
Comments:
Preliminary GPS displacement data (version 0.1) provided by the ARIA team at JPL and Caltech. All Original GEONET RINEX data provided to Caltech by the Geospatial Information Authority (GSI) of Japan.Download
(Slip Distribution)
| SUBFAULT FORMAT | FSP FORMAT | CMTSOLUTION FORMAT | SOURCE TIME FUNCTION |
References
Ji, C., D.J. Wald, and D.V. Helmberger, Source description of the 1999 Hector Mine, California earthquake; Part I: Wavelet domain inversion theory and resolution analysis,Bassin, C., Laske, G. and Masters, G., The Current Limits of Resolution for Surface Wave Tomography in North America, EOS Trans AGU, 81, F897, 2000.
GCMT project: http://www.globalcmt.org/
USGS National Earthquake Information Center: http://neic.usgs.gov
Japanese Meteorological Agency (JMA) http://www.jma.go.jp
Global Seismographic Network (GSN) is a cooperative scientific facility operated jointly by the Incorporated Research Institutions for Seismology (IRIS), the United States Geological Survey (USGS), and the National Science Foundation (NSF).
‹Back to Slip Maps for Recent Large Earthquakes home page