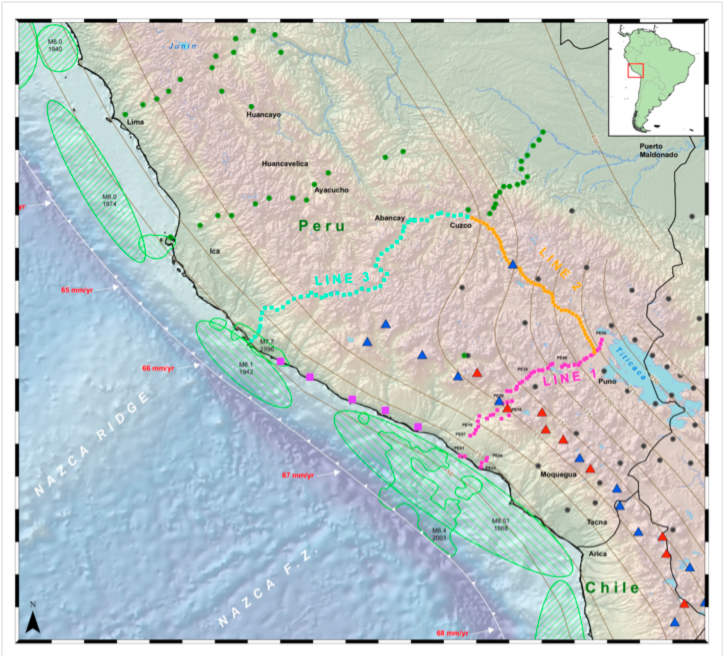
Seismometer arrays for the PeruSE project
Red dots denote Line 1, yellow dots Line 2, and light green dots Line 3.
Purple squares along the coast denote the Coastal Line.
Darker green dots denote the PULSE experiment of Wagner, Long and Beck
Black dots denote the CAUGHT experiment for Beck, Wagner, Zandt et al.
Red triangles are active volcanoes, blue triangles are inactive ones.
Thin black lines are slab contours.