Central Andean Tectonic Observatory (CAnTO) Project
CAnTO Home | People | GPS/InSAR | PeruSE | Publications | Relevant Links
GPS and InSAR

Figure 1. GPS station in Putre, Chile Credit: John Galetzka
|
We use geodetic monitoring (GPS and InSAR) to measure the distribution of present-day crustal strain and its time-dependence along the coast of Chile and Peru (see GPS data)
GPS stations, as shown in Figure 1, measure the motion of a particular place on a tectonic plate.
With a distribution of GPS stations, we measure the motion over a large area.
Such data shows that different parts of a tectonic plate move by different amounts, and thus can be used to show where stress is building up.

Figure 2. Example of GPS data from one station
|
Figure 2 shows an example of data from one GPS station.
The three components of position (vertical, east/west, and north/south) are shown for the GPS station over two years.
Notice the abrupt change in the middle of the time span, which corresponds to the Nov. 14, 2007 Tocopilla earthquake (M 7.8).
Notice also the gradual change in position over time, which corresponds to the slower "interseismic" motion of the plate.
Figure 3 shows the network of GPS stations in Chile and Peru that are used for this project. All stations are 5 Hz (meaning their position is measured 5 times per second) and thus they can be used for seismology as well. We then use the GPS data in a numerical model to determine to what extent different areas of the plate are "stuck."

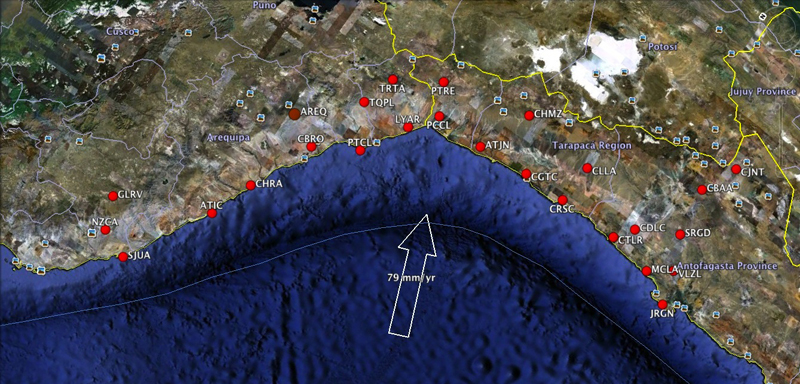
Figure 3. Network of continuous GPS stations in Chile/Peru installed as part of the CAnTO project
|

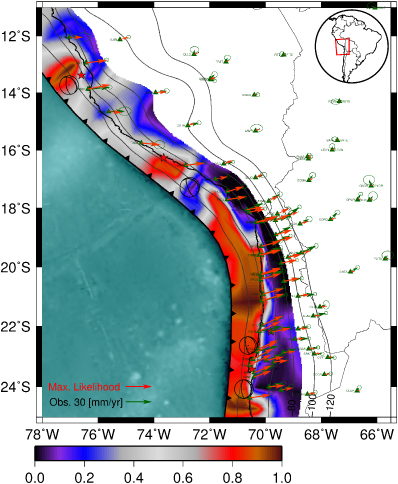
Figure 4. Extent of plate coupling
|
Figure 4 shows both the GPS data which indicates the motion at a variety of places, as well as the model results which indicate how "stuck" those places are.
Arrows are GPS data indicating both the direction and magnitude of motion.
Colors indicate model-based estimates of the extent to which the fault at the boundary between the Nazca and South American plates is "stuck" or coupled:
- red means very stuck
- blue means free
- gray means undetermined due to insufficient data or deficiencies in the model
|

